Testing Blog
RPF: Google's Record Playback Framework
Thursday, November 17, 2011
By Jason Arbon
At
GTAC
, folks asked how well the Record/Playback (RPF) works in the Browser Integrated Test Environment (
BITE
). We were originally skeptical ourselves, but figured somebody should try. Here is some anecdotal data and some background on how we started measuring the quality of RPF.
The idea is to just let users use the application in the browser, record their actions, and save them as a javascript to play back as a regression test or repro later. Like most test tools, especially code generating ones, it works most of the time but its not perfect. Po Hu had an early version working, and decided to test this out on a real world product. Po, the developer of RPF, worked with the chrome web store team to see how an early version would work for them. Why
chrome web store
? It is a website with lots of data-driven UX, authentication, file upload, and it was changing all the time and breaking existing
Selenium
scripts: a pretty hard web testing problem, only targeted the chrome browser, and most importantly they were sitting 20 feet from us.
Before sharing with the chrome web store test developer Wensi Liu, we invested a bit of time in doing something we thought was clever: fuzzy matching and inline updating of the test scripts. Selenium rocks, but after an initial regression suite is created, many teams end up spending a lot of time simply maintaining their Selenium tests as the products constantly change. Rather than simply fail like the existing Selenium automation would do when a certain element isn’t found, and require some manual DOM inspection, updating the Java code and re-deploying, re-running, re-reviewing the test code what if the test script just kept running and updates to the code could be as simple as point and click? We would keep track of all the attributes in the element recorded, and when executing we would calculate the percent match between the recorded attributes and values and those found while running. If the match isn’t exact, but within tolerances (say only its parent node or class attribute had changed), we would log a warning and keep executing the test case. If the next test steps appeared to be working as well, the tests would keep executing during test passes only log warnings, or if in debug mode, they would pause and allow for a quick update of the matching rule with point and click via the BITE UI. We figured this might reduce the number of false-positive test failures and make updating them much quicker.
We were wrong, but in a good way!
We talked to the tester after a few days of leaving him alone with RPF. He’d already re-created most of his Selenium suite of tests in RPF, and the tests were already breaking because of product changes (its a tough life for a tester at google to keep up with the developers rate of change). He seemed happy, so we asked him how this new fuzzy matching fanciness was working, or not. Wensi was like “oh yeah, that? Don’t know. Didn’t really use it...”. We started to think how our update UX could have been confusing or not discoverable, or broken. Instead, Wensi said that when a test broke, it was just far easier to re-record the script. He had to re-test the product anyway, so why not turn recording on when he manually verified things were still working, remove the old test and save this newly recorded script for replay later?
During that first week of trying out RPF, Wensi found:
77% of the features in Webstore were testable by RPF
Generating regression test scripts via this early version of RPF was about 8X faster than building them via Selenium/WebDriver
The RPF scripts caught 6 functional regressions and many more intermittent server failures.
Common setup routines like login should be saved as modules for reuse (a crude version of this was working soon after)
RPF worked on Chrome OS, where Selenium by definition could never run as it required client-side binaries. RPF worked because it was a pure cloud solution, running entirely within the browser, communicating with a backend on the web.
Bugs filed via bite, provided a simple link, which would install BITE on the developers machine and re-execute the repros on their side. No need for manually crafted repro steps. This was cool.
Wensi wished RPF was cross browser. It only worked in Chrome, but people did occasionally visit the site with a non-Chrome browser.
So, we knew we were onto something interesting and continued development. In the near term though, chrome web store testing went back to using Selenium because that final 23% of features required some local Java code to handle file upload and secure checkout scenarios. In hindsight, a little testability work on the server could have solved this with some AJAX calls from the client.
We performed a check of how RPF faired on some of the top sites of the web. This is shared on the
BITE project wiki
. This is now a little bit out of date, with lots more fixes, but it gives you a feel for what doesn’t work. Consider it Alpha quality at this point. It works for most scenarios, but there are still some serious corner cases.
Joe Muharsky drove a lot of the UX (user experience) design for BITE to turn our original and clunky developer and functional-centric UX into something intuitive. Joe’s key focus was to keep the UX out of the way until it is needed, and make things as self-discoverable and findable as possible. We’ve haven't done formal usability studies yet, but have done several experiments with external crowd testers using these tools, with minimal instructions, as well as internal dogfooders filing bugs against Google Maps with little confusion. Some of the fancier parts of RPF have some hidden easter eggs of awkwardness, but the basic record and playback scenarios seem to be obvious to folks.
RPF has graduated from the experimental centralized test team to be a formal part of the Chrome team, and used regularly for regression test passes. The team also has an eye on enabling non-coding crowd sourced testers generate regression scripts via BITE/RPF.
Please join us in maintaining
BITE/RPF
, and be nice to Po Hu and Joel Hynoski who are driving this work forward within Google.
GTAC Videos Now Available
Tuesday, November 15, 2011
By James Whittaker
All the GTAC 2011 talks are now available at
http://www.gtac.biz/talks
and also up on You Tube. A hearty thanks to all the speakers who helped make this the best GTAC ever.
Enjoy!
ScriptCover makes Javascript coverage analysis easy
Tuesday, October 25, 2011
By Ekaterina Kamenskaya, Software Engineer in Test, YouTube
Today we introduce the Javascript coverage analysis tool
,
ScriptCover
. It is a Chrome extension that provides line-by-line Javascript code coverage statistics for web pages in real time without any user modifications required. The results are collected both when the page loads and as users interact with it.
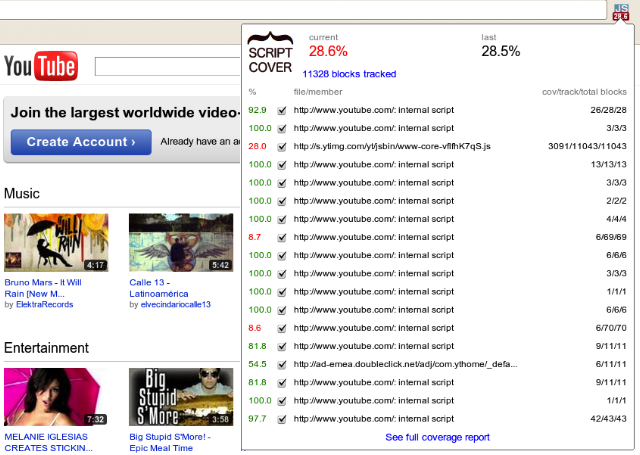
The tool reports details about total web page coverage and for each external/internal script, as well as annotated code sources with individually highlighted executed lines.
Short report in Chrome extension’s popup, detailing both overall scores and per-script coverage.
Main features:
Report current and previous total Javascript coverage percentages and total number of instrumented code instructions.
Report Javascript coverage per individual instruction for each internal and external script.
Display detailed reports with annotated Javascript source code.
Recalculate coverage statistics while loading the page and on user actions.
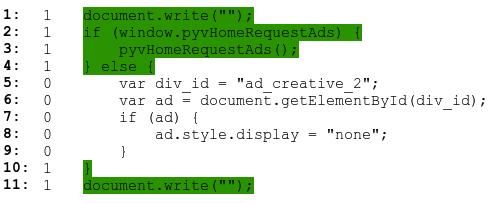
Sample of annotated source code from detailed report. First two columns are line number and number of times each instruction has been executed.
Here are the benefits of
ScriptCover
over other existing tools:
Per instructions coverage for external and internal scripts:
The tool formats original external and internal Javascript code from ‘<script>’ tags to ideally place one instruction per line and then calculates and displays Javascript coverage statistics.
It is useful even when the code is compressed to one line.
Dynamic:
Users can get updated Javascript coverage statistics while the web page is loading and while interacting with the page.
Easy to use:
Users with different levels of expertise can install and use the tool to analyse coverage. Additionally, there is no need to write tests, modify the web application’s code, save the inspected web page locally, manually change proxy settings, etc.
When the extension is activated in a Chrome browser, users just navigate through web pages and get coverage statistics on the fly.
It’s free and open source!
Want to try it out?
Install
ScriptCover
and let us know what you think
.
We envision many potential features and improvements for
ScriptCover.
If you are passionate about code coverage, read our
documentation
and
participate in
discussion group
.
Your contributions to the project’s
design
,
code base
and
feature requests
are welcome!
Google Test Analytics - Now in Open Source
Wednesday, October 19, 2011
By
Jim Reardon
The test plan is dead!
Well, hopefully. At a STAR West session this past week,
J
ames Whittaker
asked a group of test professionals about test plans. His first question: “How many people here write test plans?” About 80 hands shot up instantly, a vast majority of the room. “How many of you get value or refer to them again after a week?” Exactly three people raised their hands.
That’s a lot of time being spent writing documents that are often long-winded, full of paragraphs of details on a project everyone already knows to get abandoned so quickly.
A group of us at Google set about creating a methodology that can replace a test plan -- it needed to be comprehensive, quick, actionable, and have sustained value to a project. In the past few weeks, James has posted a few blogs about this methodology, which we’ve called ACC. It's a tool to break down a software product into its constituent parts, and the method by which we created "10 Minute Test Plans" (that only take 30 minutes!)
Comprehensive
The ACC methodology creates a matrix that describes your project completely; several projects that have used it internally at Google have found coverage areas that were missing in their conventional test plans.
Quick
The ACC methodology is fast; we’ve created ACC breakdowns for complex projects in under half an hour. Far faster than writing a conventional test plan.
Actionable
As part of your ACC breakdown, risk is assessed to the capabilities of your appliciation. Using these values, you get a heat map of your project, showing the areas with the highest risk -- great places to spend some quality time testing.
Sustained Value
We’ve built in some experimental features that bring your ACC test plan to life by importing data signals like bugs and test coverage that quantify the risk across your project.
Today, I'm happy to announce we're
open sourcing Test Analytics
, a tool built at Google to make generating an ACC simple -- and which brings some experimental ideas we had around the field of risk-based testing that work hand-in-hand with the ACC breakdown.
Defining a project’s ACC model.
Test Analytics has two main parts: first and foremost, it's a step-by-step tool to create an ACC matrix that's faster and much simpler than the Google Spreadsheets we used before the tool existed. It also provides visualizations of the matrix and risks associated with your ACC Capabilities that were difficult or impossible to do in a simple spreadsheet.
A project’s Capabilities grid.
The second part is taking the ACC plan and making it a living, automatic-updating risk matrix. Test Analytics does this by importing quality signals from your project: Bugs, Test Cases, Test Results, and Code Changes. By importing these data, Test Analytics lets you visualize risk that isn't just estimated or guessed, but based on quantitative values. If a Component or Capability in your project has had a lot of code change or many bugs are still open or not verified as working, the risk in that area is higher. Test Results can provide a mitigation to those risks -- if you run tests and import passing results, the risk in an area gets lower as you test.
A project’s risk, calculated as a factor of inherent risk as well as imported quality signals.
This part's still experimental; we're playing around with how we calculate risk based on these signals to best determine risk. However, we wanted to release this functionality early so we can get feedback from the testing community on how well it works for teams so we can iterate and make the tool even more useful. It'd also be great to import even more quality signals: code complexity, static code analysis, code coverage, external user feedback and more are all ideas we've had that could add an even higher level of dynamic data to your test plan.
An overview of test results, bugs, and code changes attributed to a project’s capability. The Capability’s total risk is affected by these factors.
You can check out a
live hosted version
, browse or check out
the code
along with
documentation
, and of course if you have any feedback let us know - there's a
Google Group set up for discussion
, where we'll be active in responding to questions and sharing our experiences with Test Analytics so far.
Long live the test plan!
Google JS Test, now in Open Source
Monday, October 17, 2011
By Aaron Jacobs
Google JS Test
is a JavaScript unit testing framework that runs on the
V8 JavaScript Engine
, the same open source project that is responsible for Google Chrome’s super-fast JS execution speed. Google JS Test is used internally by several Google projects, and we’re pleased to announce that it has been released as an open source project.
Features of Google JS Test include:
Extremely fast startup and execution time, without needing to run a browser.
Clean, readable output in the case of both passing and failing tests.
An optional browser-based test runner that can simply be refreshed whenever JS is changed.
Style and semantics that resemble
Google Test
for C++.
A built-in mocking framework that requires minimal boilerplate code (e.g. no
$tearDown
or
$verifyAll
calls), with style and semantics based on the
Google C++ Mocking Framework
.
A system of
matchers
allowing for expressive tests and easy to read failure output, with many built-in matchers and the ability for the user to add their own.
See the Google JS Test
project home page
for a quick introduction, and the
getting started
page for a tutorial that will teach you the basics in just a few minutes.
Take a BITE out of Bugs and Redundant Labor
Wednesday, October 12, 2011
In a time when more and more of the web is becoming streamlined, the process of filing bugs for websites remains tedious and manual. Find an issue. Switch to your bug system window. Fill out boilerplate descriptions of the problem. Switch back to the browser, take a screenshot, attach it to the issue. Type some more descriptions. The whole process is one of context switching; from the tools used to file the bug, to gather information about it, to highlight problematic areas, most of your focus as the tester is pulled away from the very application you’re trying to test.
The Browser Integrated Testing Environment, or BITE, is an open source
Chrome Extension
which aims to fix the manual web testing experience. To use the extension, it must be linked to a server providing information about bugs and tests in your system. BITE then provides the ability to file bugs from the context of a website, using relevant templates.
When filing a bug, BITE automatically grabs screenshots, links, and problematic UI elements and attaches them to the bug. This gives developers charged with investigating and/or fixing the bug a wealth of information to help them determine root causes and factors in the behavior.
When it comes to reproducing a bug, testers will often labor to remember and accurately record the exact steps taken. With BITE, however, every action the tester takes on the page is recorded in JavaScript, and can be played back later. This enables engineers to quickly determine if the steps of a bug repro in a specific environment, or whether a code change has resolved the issue.
Also included in BITE is a Record/Playback console to automate user actions in a manual test. Like the BITE recording experience, the RPF console will automatically author javascript that can be used to replay your actions at a later date. And BITE’s record and playback mechanism is fault tolerant; UI automation tests will fail from time to time, and when they do, it tends to be for test issues, rather than product issues. To that end, when a BITE playback fails, the tester can fix their recording in real-time, just by repeating the action on the page. There’s no need to touch code, or report a failing test; if your script can’t find a button to click on, just click on it again, and the script will be fixed! For those times when you do have to touch the code, we’ve used the Ace
(http://ace.ajax.org/)
as an inline editor, so you can make changes to your javascript in real-time.
Check out the BITE project page at
http://code.google.com/p/bite-project
. Feedback is welcome at bite-feedback@google.com. Posted by Joe Allan Muharsky from the Web Testing Technologies Team (Jason Stredwick, Julie Ralph, Po Hu and Richard Bustamante are the members of the team that delivered the product).
Unleash the QualityBots
Thursday, October 6, 2011
By Richard Bustamante
Are you a website developer that wants to know if Chrome updates will break your website before they reach the stable release channel? Have you ever wished there was an easy way to compare how your website appears in all channels of Chrome? Now you can!
QualityBots
is a new open source tool for web developers created by the Web Testing team at Google. It’s a comparison tool that examines web pages across different Chrome channels using pixel-based DOM analysis. As new versions of Chrome are pushed, QualityBots serves as an early warning system for breakages. Additionally, it helps developers quickly and easily understand how their pages appear across Chrome channels.
QualityBots is built on top of
Google AppEngine
for the frontend and Amazon EC2 for the backend workers that crawl the web pages. Using QualityBots requires an Amazon EC2 account to run the virtual machines that will crawl public web pages with different versions of Chrome. The tool provides a web frontend where users can log on and request URLs that they want to crawl, see the results from the latest run on a dashboard, and drill down to get detailed information about what elements on the page are causing the trouble.
Developers and testers can use these results to identify sites that need attention due to a high amount of change and to highlight the pages that can be safely ignored when they render identically across Chrome channels. This saves time and the need for tedious compatibility testing of sites when nothing has changed.
We hope that interested website developers will take a deeper look and even join the project at the QualityBots
project page
. Feedback is more than welcome at qualitybots-discuss@googlegroups.com.
Posted by Ibrahim El Far, Web Testing Technologies Team (Eriel Thomas, Jason Stredwick, Richard Bustamante, and Tejas Shah are the members of the team that delivered this product)
Labels
Aaron Jacobs
1
Adam Porter
1
Alan Faulkner
1
Alan Myrvold
1
Alberto Savoia
4
Alek Icev
2
Alex Eagle
1
Allen Hutchison
6
Andrew Trenk
8
Android
1
Anthony Vallone
25
Antoine Picard
1
APIs
2
App Engine
1
April Fools
2
Arif Sukoco
1
Bruce Leban
1
C++
11
Chaitali Narla
2
Christopher Semturs
1
Chrome
3
Chrome OS
2
Dave Chen
1
Diego Salas
2
Dmitry Vyukov
1
Dori Reuveni
1
Eduardo Bravo Ortiz
1
Ekaterina Kamenskaya
1
Erik Kuefler
3
Espresso
1
George Pirocanac
2
Google+
1
Goranka Bjedov
1
GTAC
54
Hank Duan
1
Harry Robinson
5
Havard Rast Blok
1
Hongfei Ding
1
James Whittaker
42
Jason Arbon
2
Jason Elbaum
1
Jason Huggins
1
Java
5
JavaScript
7
Jay Han
1
Jessica Tomechak
1
Jim Reardon
1
Jobs
14
Joe Allan Muharsky
1
Joel Hynoski
1
John Penix
1
John Thomas
3
Jonathan Rockway
1
Jonathan Velasquez
1
Julian Harty
5
Julie Ralph
1
Karin Lundberg
1
Kaue Silveira
1
Kevin Graney
1
Kirkland
1
Kurt Alfred Kluever
1
Lesley Katzen
1
Marc Kaplan
3
Mark Ivey
1
Mark Striebeck
1
Marko Ivanković
1
Markus Clermont
3
Michael Bachman
1
Michael Klepikov
1
Mike Wacker
1
Misko Hevery
32
Mobile
2
Mona El Mahdy
1
Noel Yap
1
Patricia Legaspi
1
Patrick Copeland
23
Patrik Höglund
5
Peter Arrenbrecht
1
Phil Rollet
1
Philip Zembrod
4
Pooja Gupta
1
Radoslav Vasilev
1
Rajat Dewan
1
Rajat Jain
1
Rich Martin
1
Richard Bustamante
1
Roshan Sembacuttiaratchy
1
Ruslan Khamitov
1
Sean Jordan
1
Sharon Zhou
1
Shyam Seshadri
4
Simon Stewart
2
Stephen Ng
1
Tejas Shah
1
Test Analytics
1
Tony Voellm
2
TotT
54
Vojta Jína
1
WebRTC
2
Yvette Nameth
2
Zhanyong Wan
6
Zuri Kemp
2
Archive
2015
December
GTAC 2015 Wrap Up
November
October
August
June
May
April
March
February
January
2014
December
November
October
September
August
July
June
May
April
March
February
January
2013
December
November
October
August
July
June
May
April
March
January
2012
December
November
October
September
August
2011
November
October
September
August
July
June
May
April
March
February
January
2010
December
November
October
September
August
July
June
May
April
March
February
January
2009
December
November
October
September
August
July
June
May
April
February
January
2008
December
November
October
September
August
July
June
May
April
March
February
January
2007
October
September
August
July
June
May
April
March
February
January
Feed
Follow @googletesting